
 |
 |
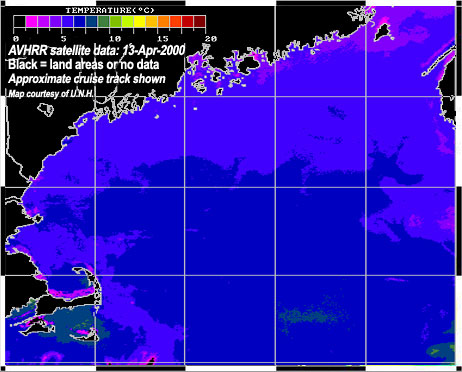
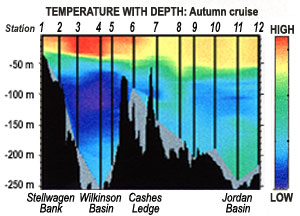
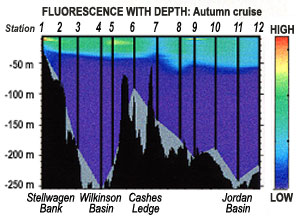
At left is a map view of Gulf of Maine surface
temperature, taken just before our autumn cruise.
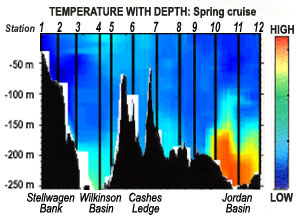
Our approximate track is shown from Station 1 to 12. Below
it is an image of temperature versus depth from Station 1 - 12 profiles; underwater
banks, ledges and basins are shown, as well. Click on maps
to see larger versions.
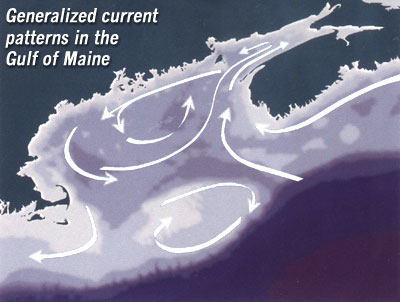 |
How does surface temperature compare
to current patterns?
|
What is the pattern
of temperature with depth along track (<<<)? Are
there any "blobs" of unusually hot or cold water at depth?
Where might these water masses have come from?
 |
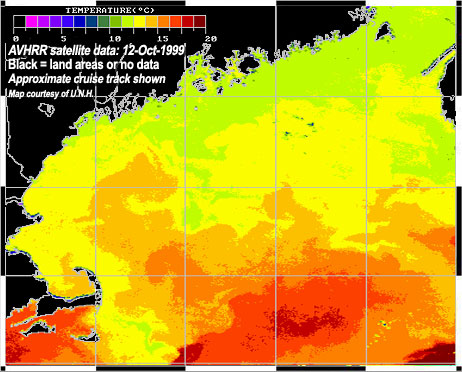
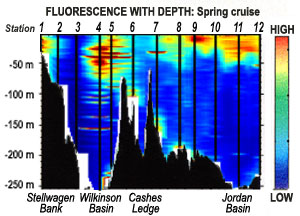
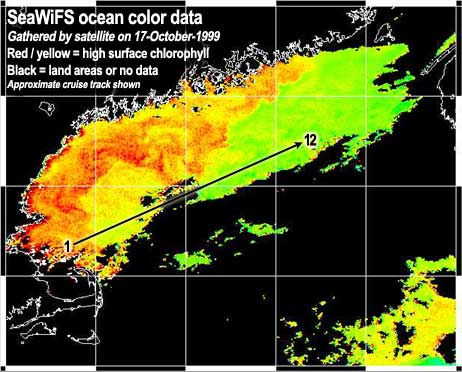
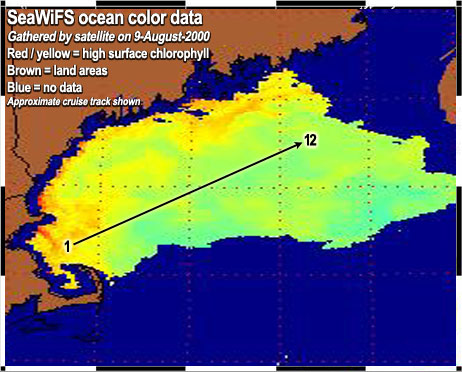
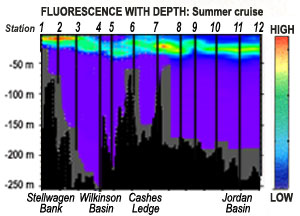
Chlorophyll content is used to estimate the productivity of phytoplankton. At right (>>>) is a map view of chlorophyll in surface Gulf of Maine waters. Below it are fluorescence versus depth data collected during our cruise.
What is the general pattern of chlorophyll with depth (lower image)? Is this what you expected based on surface data (upper image)?
 |
 |
|
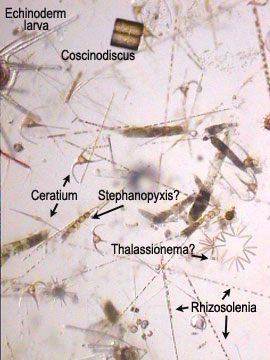
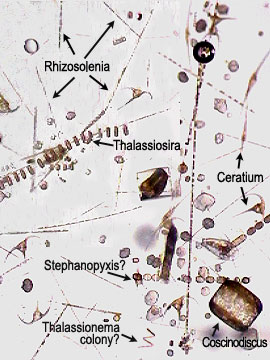
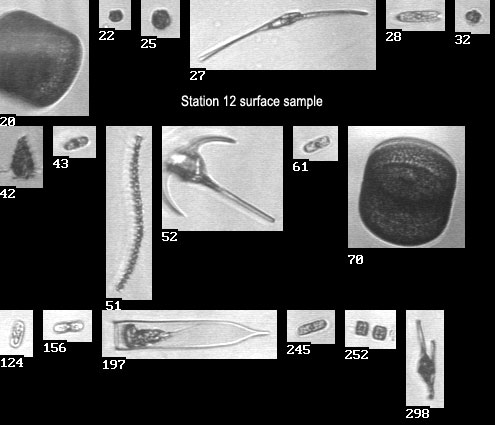
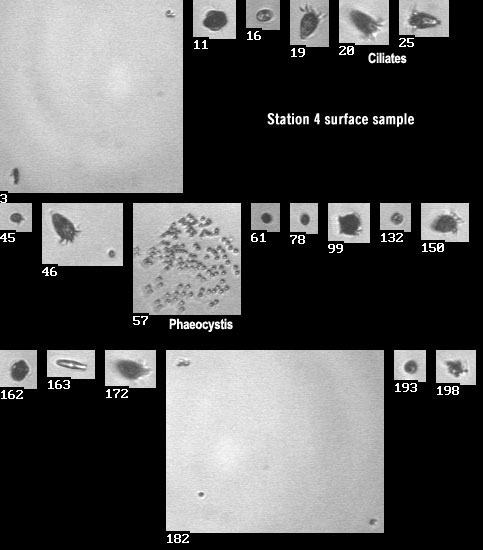
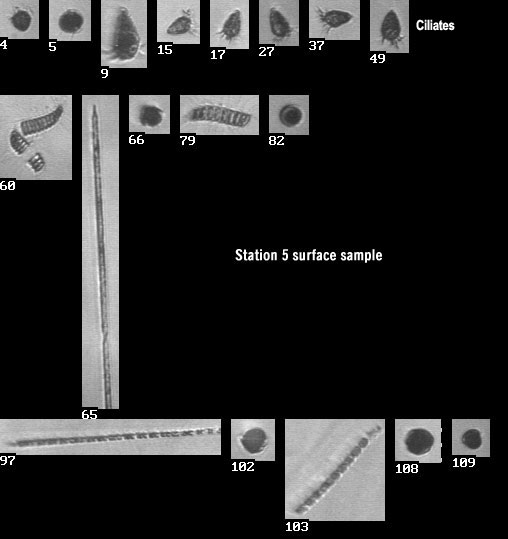
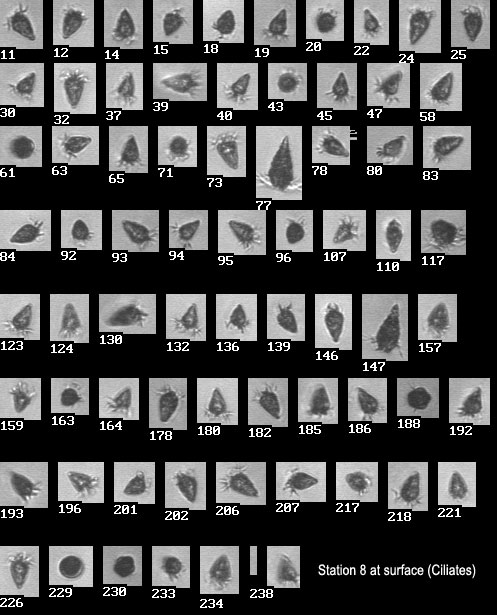
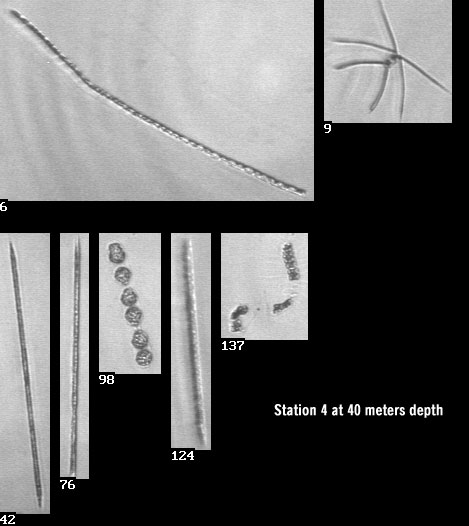
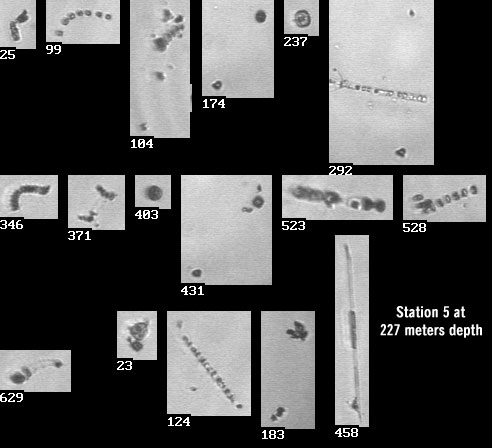
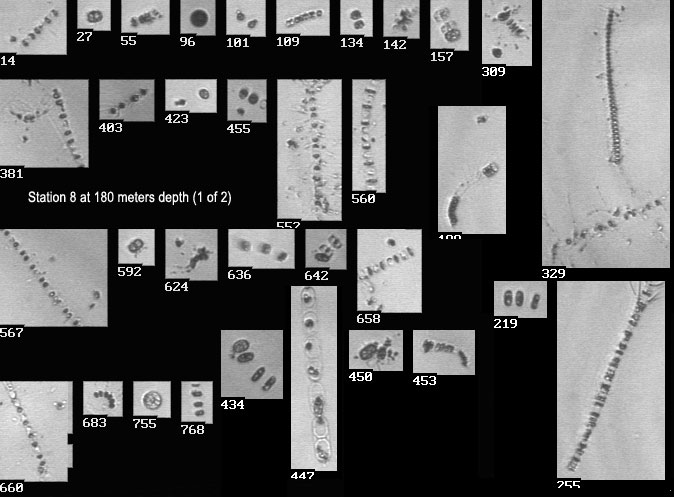
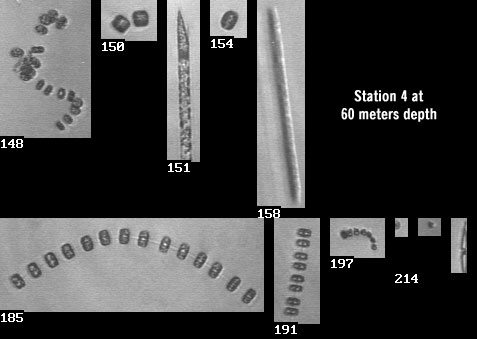
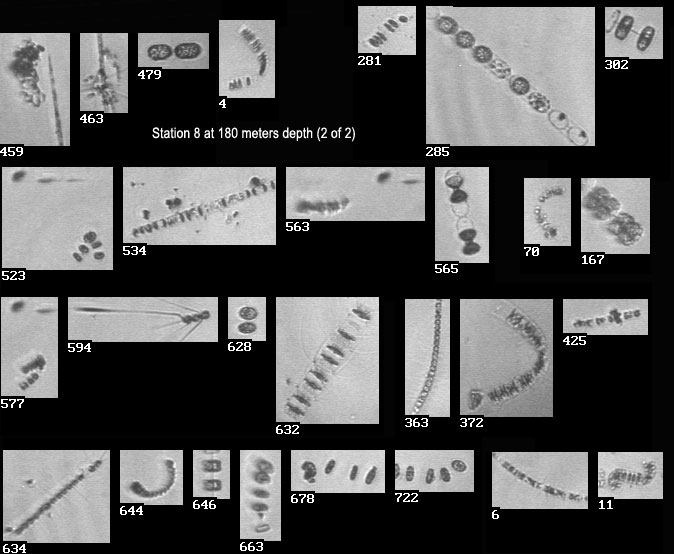
Note the deep patches of high fluorescence (>>>). For these four stations, compare images of plankton collected near the surface to those from deeper waters: |
|||
|
Do plankton assemblages change
with depth? What does this mean for the ecosystem? (Dr.
Mike has hints.)
|
|||