
 |
 |
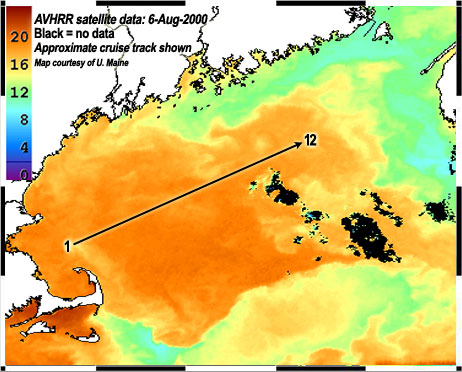
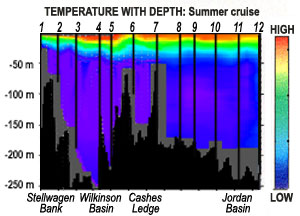
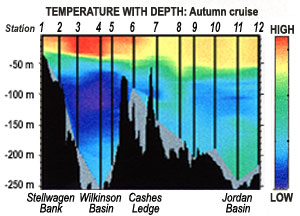
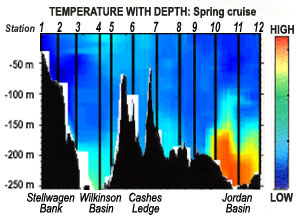
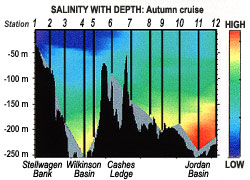
At left is a map view of Gulf of Maine surface temperature, taken just before our autumn cruise. Our approximate track is shown from Station 1 to 12. Below it is an image of temperature versus depth from Station 1 - 12 profiles; underwater banks, ledges and basins are shown, as well. Click on maps to see larger versions.
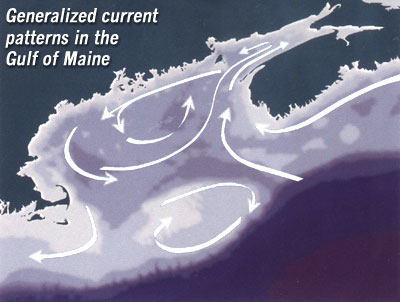 |
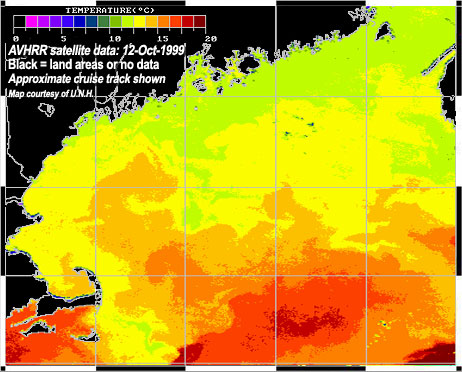
How does surface temperature compare
to current patterns?
|
 |
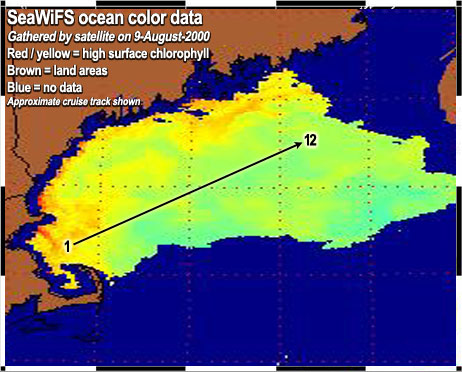
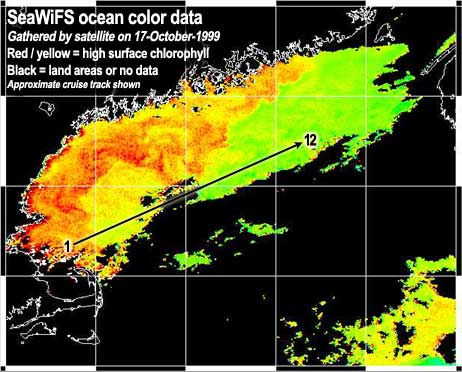
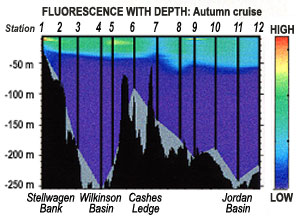
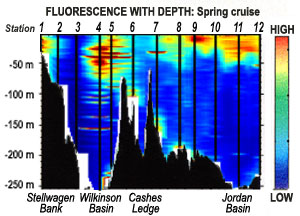
Chlorophyll content is used to estimate the productivity of phytoplankton. At right (>>>) is a map view of chlorophyll in surface Gulf of Maine waters. Can you detect a general pattern of surface productivity?
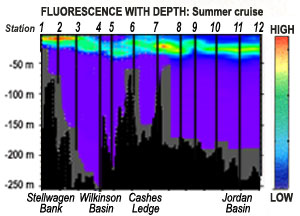
Below it, fluorescence versus depth data collected during our cruise -- from Station 1 to Station 12 -- are shown.
What is the general pattern of chlorophyll concentration? Does it change from southwest ("1") to northeast ("12")?
Is this what you expected based on surface data?
 |
 |