|
"Eyes in the Sky" Used
to Help Watch Our Weather
|
||||||||||
|
|
|
|
|
|
|
|
|
|
||
 |
|
Before learning more about weather, you may wish to find out more about how weather is viewed ("sensed") from high above Earth's surface ("remotely").
- The University of Illinois' "WW2010" website has an "On-line guide" for Remote Sensing.
- Their webpage specifically addresses both "Radar" and "Satellites."
You can learn A LOT about how remote sensing is used to watch weather in your area from the National Weather Service (NWS).
- Use the NWS Offices for the U.S. "clickable map" fo find the Forecast Office located nearest to you.
- Your local NWS Office website may provide on-line remote sensing data; Look for the word(s) "Radar" and / or "Satellite."
To access these "remote sensing" images:
- Go to the bottom of the main menu;
- Click on the words "Weather Graphics including Radar and Satellite imagery."
The "Latest Satellite" data sets are from "GOES," an acronym for Geostationary Operational Environmental Satellites.
- "Geostationary" = "Earth" + "unmoving"
| National Weather Service Forecast Office Gray, Maine |
- Aviation Weather
- Weather Graphics including Radar and Satellite imagery
| Latest Satellite | |||||||||||||||||||
|
|||||||||||||||||||
A satellite in a geostationary orbit circles the earth once every 24 hours, the same amount of time it takes for Earth to spin on its axis. (See cartoon sequence below, VVV)
For a full view of the continental U.S., two satellites are used: GOES-8 and GOES-9 (links provided above).
Here are two web links to help you learn more about GOES satellites:
- Gulf of Maine Aquarium's "Weather Satellites"
- WWW2010: GOES satellites
A geostationary satellite turns eastward along the equator. It stays above the same point on Earth at all times:
 |
 |
 |
 |
The GOES satellites provide data for these three types of maps :
1) Infrared ("IR") wavelength (>>>): IR data show the pattern of thermal -- or heat -- that is radiated from an area. For an infrared picture, warmer objects appear darker than colder objects. Infrared sensors pick up data both day and night. Heat-producing areas, such as warm water currents or cities are bright spots on infrared images. Clouds appear in varying shades of grey, depending on their temperature, which is determined by their height above Earth.

2) Visible wavelength (<<<): These satellite images are similar to pictures a photographer might record in that they rely on and display reflected light. Clouds appear white to us because they reflect light. Since visible imagery depends on available light, it can only be detected during the day.
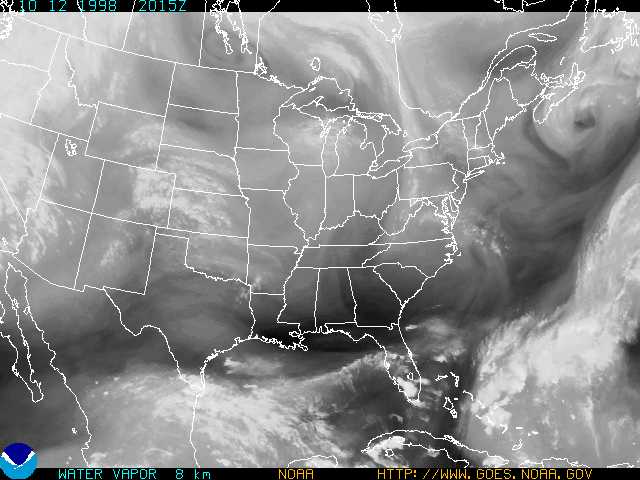
3) Water vapor (>>>): Atmospheric water vapor is an important factor in determining local weather and global climate. On these maps, white and light grey areas contain the most water vapor, while the dark areas are the driest. Very bright areas are storms and hurricanes. Big spirals show large-scale circulation patterns in earth's atmosphere.
- Radar uses radio waves to measure the time it takes to send and receive electromagnetic pulses.
- Although some radar pulses -- for example, microwaves -- can "see through" clouds, weather radars are used to see the density or thickness of clouds.
- Radar images are useful for locating precipitation.
| Latest Radar | ||||||||
|
||||||||
- A radar sends a pulse of energy into the atmosphere and if any precipitation is intercepted by the energy, part of the energy is scattered back to the radar. These returned signals -- called "radar echoes" -- are used to make radar images.
- Each of the "Latest Radar" links display their data somewhat differently. However, ALL sets use color-coding to show the relative thickness of cloud cover.

- Each GOES satellite can see half of the earth's
surface.
- Given that the U.S. does NOT cover half the earth, why do meterologists need TWO of these satellites to observe U.S. weather?
- To help answer this question, you may want to click on the current "U.S. Visible" images for GOES-8 and GOES-9.
- Click here to see the coverage of GOES-8 and GOES-9 for further help.
- Weather systems are generally moved along the
"jet stream": high-level winds that "push"
weather across the U.S.
- What direction does the "jet stream" usually flow?
- Given your answer, where do most of the weather systems that affect the continental U.S. originate?
- Does this help explain why two GOES satellites are used to monitor U.S. weather?
- There is a notable weather phenomenon that is
usually "spawned" in the Atlantic ocean and moves westward toward
the U.S.
- Can you name this "weather phenomenon"?
- HINT: You can click
here to learn more about one such "weather phenomenon"
named "Hugo." (This activity will show you how to ACCESS
TRACKING DATA on the Internet!)
- Click here to see an animation of "Hugo"
- Meteorlogists use sets of satellite AND radar data
to understand and forecast weather.
- Look at the following satellite data for 10-October-98:
- How did the patterns of temperature (IR image),
reflected light (visible image) and atmospheric water vapor compare
with each other on that date?
- Click here to see
one example of a radar image for that date ("National Summary"
from University of Washington).
- Were the 10-October-98 precipitation patterns consistent with the satellite data?
- Which of the three satellite maps ---
IR, visible, or water vapor -- best matched the precipitation
patterns?
- Does this answer surprise you?
- Click here to see
one example of a radar image for that date ("National Summary"
from University of Washington).
- Look at the LATEST GOES-8 satellite data for
the EASTERN U.S. by clicking on these links:
- Infrared (IR)
- Water vapor
- Visible
- Based on these data, what are the current
precipitation patterns in the eastern U.S.?
- Click here to check your answer.
- What are the current precipitation patterns
over New England?
- Click here to check your answer.
- Based on these data, what are the current
precipitation patterns in the eastern U.S.?
- You can also check out the LATEST GOES-9 satellite
data for the WESTERN U.S. by clicking on these links:
- Infrared (IR)
- Water vapor
- Visible
- Based on these data, what are the current
precipitation patterns in the western U.S.?
- Click here to check your answer.
- Based on these data, what are the current
precipitation patterns in the western U.S.?
- If you were searching for life on other planets, which of these data -- IR, visible, or water vapor -- would serve you best? Why?
- To learn more about remote sensing of other planets, click here to access the "Scattering Light" activity.
- Infrared (IR) data help to spot heat-producing areas, such as warm water currents.
- Would it help to find a person missing in Antarctica?
- What about a person missing in the desert?
- Do you think that IR data can be used to distinguish
a city from a desert on a hot day?
- What about at night?
- Can you think of other practical "everyday" applications of IR data?
 |
|
|
|
 |
|
 |
|

|
|
|
|
|
|||||||