|
|
Research Climate,
Physical, and Ecological Setting
|
|
|
|
|
|
|
|
|
|
|
|
|
|
|
|
|
|
|
|
|
 |
- Scientists measure temperature and precipitation over a long
time period to quantify an area's climate
- Phoenix, Arizona and San Diego, California are separated by only
300 miles but have very different climates and physical settings
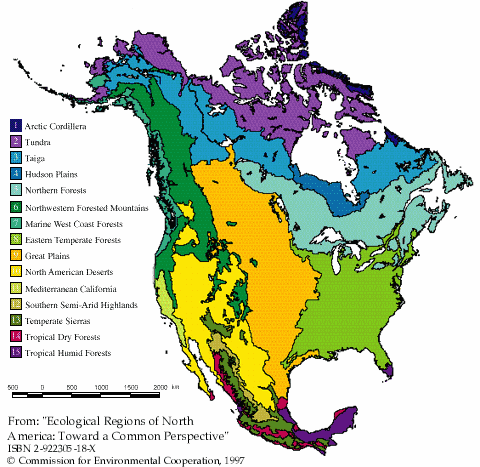
- Ecological regions -- such as deserts -- are defined by climate
and physical setting
|
|
|
Climate is weather averaged over a long period of time.
- To quantify "average weather," scientists measure things
such as temperature and rainfall / snowfall (precipitation) over
many years.
Ecological regions are tied to physical setting and climate.
- To better understand this, you will compare two U.S. cities -- Phoenix,
Arizona and San Diego, California.
- These cities are separated by about 300 miles.
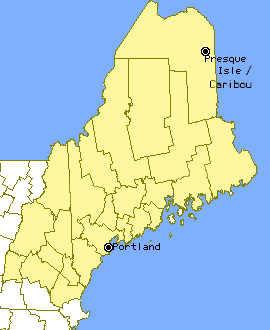
- We will also investigate another pair of U.S. cities that are separated
by about the same distance: Portland, Maine and Presque
Isle / Caribou, Maine).
- You can also conduct the same study for other pairs of U.S. cities. A
good place to begin is the "National
Weather Service Offices for the U.S." website.
- They have a "clickable map" that features links to many
U.S. cities.
- Look for the either the word "climate" or "climatology"
(which is the study of climate) to find "average weather"
data.
|
|
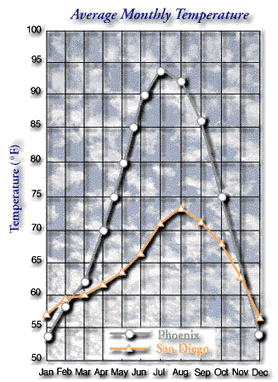
Phoenix, Arizona facts:
- Region has a desert climate: arid ("dry and barren")
with marked seasonal temperature extremes;
- See monthly average temperature plot (right, >>>).
- It is located in the "rain shadow" of high mountain ranges that
intercept wet winter air masses blown by winds (Click
here to see a movie about this type of "orographic precipitation";
1 MB);
- Average annual precipitation is about 7.7 inches per year;
- See plot of monthly average rainfall (below, VVV);
- It is part of the "North American
Desert" ecological region;
- Physical setting consists of plains with hills, plains with mountains,
and tablelands of high relief.
|
|
 |
|
 |
|
San Diego, California facts:
- Temperatures are characterized by hot, dry summers and mild winters (see
above, ^^^);
- Rainfall is mostly from winter frontal storms that sweep in from the Pacific
Ocean;
- Yearly precipitation total is about 9.9 inches.
- Rain falls mostly from November to April (see graph at left, <<<).
Year-to-year rainfall totals can vary a lot and extreme droughts are not
uncommon;
- Coastal fog is common, particularly from May through July.
- It is part of the "Mediterranean Californian"
ecological region.
- This ecological region is found ONLY in parts of California and northernmost
Mexico (Tijuana);
- The physical setting is an urban area that stretches over low hills and
mesas, occupying a rectangle of about 50 miles by 12 miles (80 km by 20
km) along the Pacific Coast.
|
|
Now that you know more about analyzing climate data, you will research similar
data from Portland, Maine and Caribou, Maine.
|
|
You can do the same type of analysis for other places, starting at the "National
Weather Service Offices for the U.S." website.
- For each city, find either the word "climate" or "climatology."
- From there, look for "Monthly Climate Normals" or "Monthly
Climate Summaries." These usually have data that are averaged over
30 YEARS (from 1961-1990).
- You should see (or can easily estimate) ONE average mean temperature
for each month.
- Likewise, you should be able to find (or easily sum up) ONE average
mean precipitation for each month.
- Alternatively, you can access "Normal Mean Temperature" (in
degrees Fahrenheit) for many U.S. cities by
clicking here.
- Note that the first column of this chart shows that the climate data
have been collected over many (usually 30) years, the last column shows
the normal ANNUAL mean temperature, and the middle 12 columns are January
through December.
- Click here
to see "Normal Monthly Precipitation" (in inches) for many U.S.
cities.
|
|
 |
- Use data from
National Weather Service Forecast Offices to evaluate the climate
of U.S. cities
- Graph average monthly temperature and precipitation data for
both areas
- Discover the appropriate ecological region(s) for different U.S.
cities
|
|
|
- Graph "Monthly Temperature Normals" for
two cities (either Portland/Caribou or another city pair). You can create
a graph similar to the one shown for Phoenix and
San Diego with horizontal gridlines every 5°F.
- Graph monthly "Precipitation Normals (water
equivalent)" for two cities (either Portland/Caribou or another city
pair).
- Consider what you've learned about physical setting
and ecological regions from the Phoenix and San Diego examples.
|
|
 |
- arid
- climate
- climatology
- ecological regions
|
- orographic precipitation
- physical setting
- precipitation
|
|
|
|
|
|
|
|
|
|
|
|
|
|
|
|
|
|
|
|
|
|
|
|
|
|
|
|
|
|
|
|
|
|
|
|
 |
|
|
|
|
|


