OCEAN CURRENTS AND COASTAL TEMPERATURES

OVERVIEW

Students will chart the temperatures of two cities at approximately the same latitude but on different sides of North America. They will develop a hypothesis that explains the temperature differences between the two cities and create an air temperature model to test their hypothesis. They will measure the air temperature over a "cold water current" and a "warm water current."


CONCEPTS

  • Cooler ocean currents cause cooler land temperatures, and warmer ocean currents cause warmer land temperatures in coastal regions.


MATERIALS

  • 2 One-gallon glass or plastic jars with lids per group of four students
  • 2 Thermometers per group of four students
  • String
  • Hot tap water
  • Cold tap water
  • 5 Consecutive days of the weather section of the newspaper
  • Graph paper
  • Map of the United States
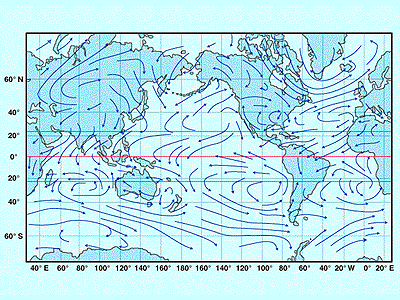
  • Maps of winds and wind-driven ocean currents (provided below)


PREPARATION

  • This activity works best as a small group activity or as a demonstration.
  • Collect several gallon jars. Punch a hole in the lid of each of the jars. The students will need to suspend the thermometers in the jars through their lids.
  • Set up one equipment tray for each group. Each tray should have two jars, two thermometers and some string. The students need access to hot and cold tap water. If you are using glass jars, remind the students that the glass will get hot (you might wish to add gloves to the equipment list). Test hot water in the jars before doing the classroom activity to make sure they do not crack.


PROCEDURE


Engagement

  • Warm and cold water currents can affect the climate of coastal regions. Use a map of the United States to find two coastal cities at the same latitude but on different sides of the continent (e.g. San Francisco, CA and Norfolk, VA). Chart the temperatures (highs) of these two cities. Use at least a week of daily temperatures. Develop a hypothesis that explains the differences in temperature.


Activity

  1. Suspend a thermometer through the hole in the lid of each jar. Do not add water yet.
  2. Set the jars next to each other and measure the temperature of the air inside each jar. Plot the temperature versus time on graph paper. Take measurements until the temperature in both jars is about equal.
  3. Fill one jar half-full with warm water and one jar half-full with cold water. Wait five minutes and take the temperature of air above the water in each jar. Repeat after five additional minutes. Is the tempera-ture of the air changing? Why?
  4. Locate your two cities on the map of United States. Also look at the chart of currents. Use the informa-tion on the current chart and from your model to determine if there is a warm or a cool water current flowing off each coast. Compare this new information to the hypothesis that you originally developed. Was your original hypothesis correct? If not, develop a new hypothesis to explain why these two cities at the same latitude, which receive similar amounts of solar radiation, have such different temperatures.


Explanation

  • Warm and cold ocean currents can affect the climate of coastal regions, but only when local winds blow in from the sea. Warm currents heat the air over the ocean and bring higher temperatures over land. Cold currents can lower air temperatures and can bring colder temperatures over land.
  • Because the current that runs along the California coastline runs from north to south, the temperature of cities along the coast is cooler. On the eastern side of the United States, the Gulf Stream is a warm water current, South of Cape Hatteras, North Carolina, that comes up from equatorial regions. Because of this, the southeastern coastal cities have warmer temperatures than western coastal cities.
 

EXTENSION

  • To test the understanding of the students, give them the global temperature section of the newspaper. Have them locate the cities on a world map and plot the temperatures next to the cities. See if they can determine if the current off each coastline is a warm or a cold water current.
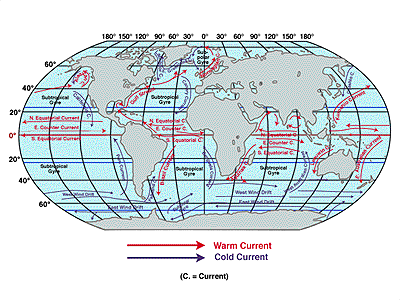
  • Alternatively, have your studenst look at the map of surface current that shows warm and cold currents (provided below). They can use this to try to predict the climate of coastal areas throughout the world. Have them compare their predictions to weather and climate data from newspaper, the Internet, or an almanac.


Figure 1a. Global wind patterns for a typical month of January. Note the similarities and differences between large-scale wind and current patterns (Fig. 1b).
Figure 1b. Global wind-driven surface currents for a typical January. Warm currents are shown in red and cold currents are colored blue. Note the similarities and differences between large-scale ocean current and wind patterns (Fig. 1a).


VOCABULARY

  • current: a smooth and steady onward movement of a fluid (i.e., liquid or gas). The part of any body of fluid that has a continuous onward movement.
  • hypothesis: an assumption made to account for or relate known facts.
  • latitude: location on Earth's surface based on angular distance north or south of the equator. Equator, 0°; North Pole, 90°N; South Pole, 90°S.
  • model: system of data, inferences, and relationships, presented as a description of a process or entity.


SOURCE

  • Adapted from "Visit to an Ocean Planet" educational CD-ROM, Copyright Caltech and NASA/Jet Propulsion Laboratory
  • Orange County Marine Institute, San Juan Capistrano, CA