|
- Wind speed is given in many different ways: In the
U.S., it is usually given as "miles per hour" or "mph."
For most, this is easy to understand because that's how car speeds are measured.
However, many meteorlogists prefer using "knots." One "knot"
= a speed of one nautical mile per hour.
- One knot equals 1.15 mph (miles per hour).
- Is a nautical mile shorter than, longer than,
or equal to a "regular" (also known as a "statute")
mile?
- Most U.S. scientists use the metric system. (This
system is used by everyone -- scientists and "regular" people
-- in most non-U.S. countries.) The conversion between nautical
miles and meters is: 1 nautical mile = 1852 meters.
- Is this consistent with the "Wind Gust"
data in the table above that shows a speed of 1.9 knots equals 1 meter
per second? (HINT: 1 hour = 60 minutes X 60 seconds)
- How many miles per hour (mph) equals a speed
of 1 meter per second?
- Wave height is shown to be 2.3 feet ("English
units"), which is equal to 0.7 meters (metric).
- What is the conversion between these two units
of length? In other words, how many feet equal 1 meter?
- Is a meter less than, greater than, or equal to
1 yard?
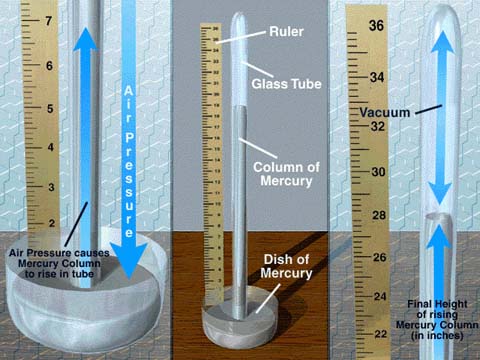
- A standard barometer measures the pressure
exerted by the mass of the atmosphere on a tube of mercury. It was first
devised in 1644 by Evangelista Torricelli, who had noted that a column
of water in a tube could not be made to stand to a height greater than
34 feet. Torricello experimented with many fluids of different
densities and found that mercury (a liquid
metal 14 times heavier than water) would only stand to height of about
30 inches.
- Can you guess why Torricelli preferred to use
mercury rather than water to measure atmospheric pressure?
- In the table above, "Atmosopheric Pressure"
is given in units of "inches" and "millibars."
The definition of "millibar" is "one-thousandth of
a unit pressure" known as a "bar" (10^5 newtons per
square meter, a measure of force per area).
- Is "inches" a unit of pressure?
How is a barometer reading of "inches"
related to pressure?
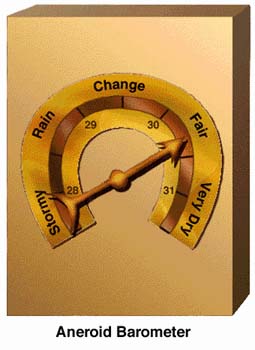
- Day-to-day measurements of pressure
use aneroid ("without
air") systems: these are evacuated metal chambers that
expand and contract with changes in outside air pressure.
This drives a series of mechanical levers that produce a
reading of pressure. Interestingly, the display is calibrated
as if the instrument was measuring the height of a mercury
column. [From "The Handy Weather Answer
Book," Walter A. Lyons,1997, Accord Publishing Ltd.,
ISBN 0-7876-1034-8]
- Air and water temperatures are given degrees Fahrenheit
("English units") and Celsius (metric).
- In the table above, temperatures
for the air and water are given as:
- 70.5 F / 21.4 C
- 67.8 F / 19.9 C
- Click here and print
out the graph of degrees Fahrenheit vs. Celsius. Plot these 2 points and
try to connect them with a line. (Skip to next line if you need more data
points to answer the following questions.)
- Can you tell the slope of the line from these
2 points?
- Can you see where your line crosses at 0 degrees
Celsius?
- Can these results help you easily convert
degrees Fahrenheit to Celsius and vice versa?
- For more data points, you can access the latest
data from these National Data Buoy Center webpages.
- If you don't have enough data to find the slope
or 0 degrees Celsius crossing point, consider this:
- Five weeks earlier, the mid-afternoon air
temperature at Buoy #44005 (above) was 52.9 F
/ 11.6 C and its water temperature = 51.4 F / 10.8 C
- Five weeks later, the mid-morning air temperature
at Buoy #44005 (above) was 58.8 F / 14.9 C and
its water temperature = 54.5 F / 12.5 C
|


