
|
Data collection at sea is a complicated
process, especially given that the science is done in a relatively
small lab space on a rolling ship. Work at sea is usually conducted
in shifts: on this cruise we had two teams that worked 12 hours
per day, every day, during the 14-day voyage.
|
||
 |
||
|
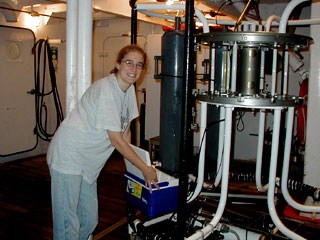
At each station, the instrument rosette containing
Niskin bottles (tall grey cylinders, <<) was lowered to a
designated depth (from 15 to 300 meters, depending on the ocean
regime). Along the way, a fluorometer measured in-water chlorophyll
concentrations and a "CTD" instrument provided temperature
and salinity
data. As the rosette was raised through the water column, the bottles
were triggered to "grab" water at various depths. Once
the rosette was hoisted on deck, Ilana gathered her water samples
for subsequent in-lab analysis.
|
||
 |
|
|
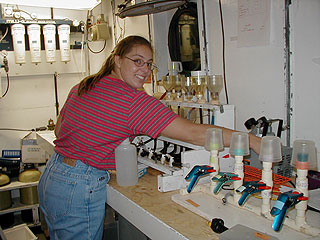
Water samples were filtered to concentrate cells
into two size ranges: <3 micrometers
and <20 micrometers. Renee then soaked the filters in acetone
to extract chlorophyll from the cells. The acetone was then exposed
to a beam of blue light: this excited the chlorophyll within the
solution, causing it to emit red light. The red emisssion quantified
the amount of chlorophyll in each sample.
|
|
 |
Another important onboard
activity was making nanoplankton
and bacteria slides. Polly added stains to water samples,
making identification of DNA and cytoplasm
easier. The water was then filtered through a black membrane which
was placed on a microscope slide, topped with a drop of oil and
a cover slip. Thus these slides are not transparent: the microscope
illuminates them from above (rather than below). The type of light
(e.g., fluorescent
blue, green, and ultraviolet) is specifically chosen to excite the
slides' stained material.
|
|
|
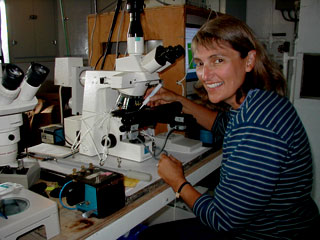
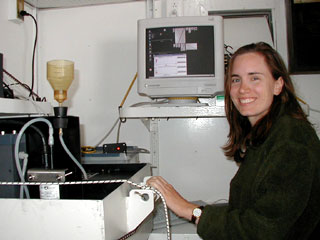
Flow
cytometry is used to measure
the optical properties of cells in a flow stream. Plankton
are naturally in suspension, thus flow cytometry is a good way to
study them. Based on this technology, the FlowCAM instrument has
a fluorescence detector
that can pinpoint hundreds of cells per minute. It then counts and
images those cells that contain photosynthetic
pigments. At each station
Nicole used FlowCAM to study plankton populations within water samples
collected at various depths. In this way, she studied phytoplankton
and some small zooplankton sized from 5
- 200 micrometers. Why
might zooplankton have photosynthetic pigments?
|
 |
|
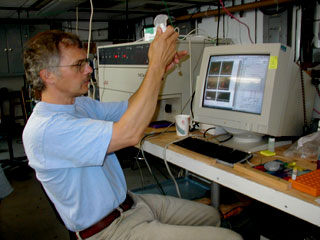 |
Like the FlowCAM, the FACScan
is a flow cytometer. This instrument, however, is designed to count
(but not image) smaller phytoplankton cells. For this study, the
FACScan was primarily being used to count bacteria and help determine
what percentage of these cells are active. How is this done? Before
Ed "ran his samples," he used a stain that indicates which
bacteria are actively respiring. The FACScan also counts larger
cells (e.g., up to 15 micrometers); this information helps to characterize
the biological cycles where bacteria thrive. (See discussion
on the Micobial
Loop.)
|
|
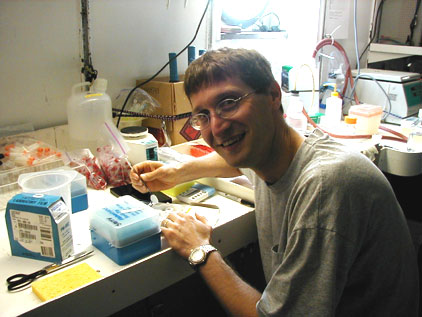 |
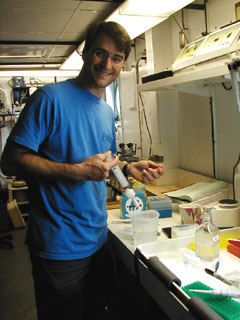
A direct way of measuring
bacterial growth rates is through the use of radioactive tracers.
A radioactive substance was introduced into water samples, which
were then incubated. Active cells took the tracer into their proteins,
making it possible to calculate the percentage of active cells.
David (>>) also stained water samples with a substance that
adheres to nucleic
acids (i.e., DNA or RNA) and filtered the stained water to allow
only viruses through. Stained viruses were later analyzed under
fluorescent light with a high-powered microscope. Andrew (<<)
collected DNA samples to study the structure of the marine bacterial
community. Lastly, dissolved
organic carbon (DOC) was measured as carbon dioxide gas emitted
from water samples that were heated to 680°C (1256°F).
|
 |