 |
|
"Ocean bottom topography" is also known as bathymetry ("measurement of the depth of of large bodies of water")
On-line maps of "Measured and Estimated Seafloor Topography" are available from Scripps Institute of Oceanography, the National Oceanic & Atmospheric Administration, and Lamont Doherty Earth Observatory.
- These digital bathymetric maps were created by combining ship depth soundings with high-resolution marine gravity data from Earth-orbiting satellites.
- At this website, you can get a map of any part of the world's ocean by clicking on your area of interest.
- The data maps are color-coded for easier interpretation.
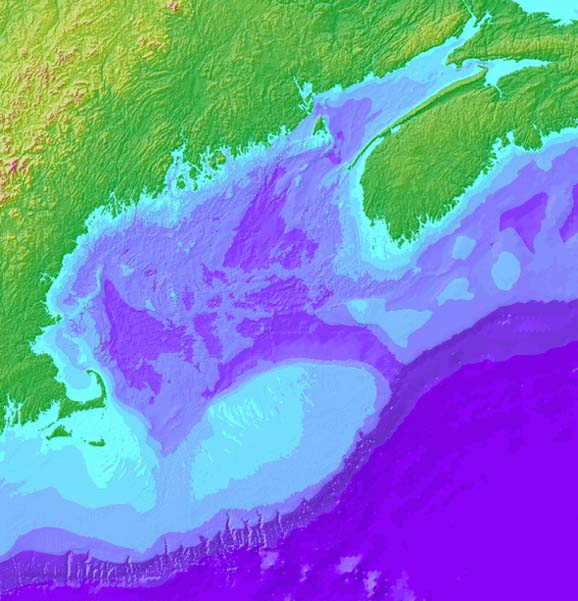
At right (>>>) is a view of bathymetry from Nova Scotia to Cape Hatteras, North Carolina. The continental margin extends from the shoreline to the deep-ocean basin. The deep ocean is shown in blue and reaches about 5000 meters depth.
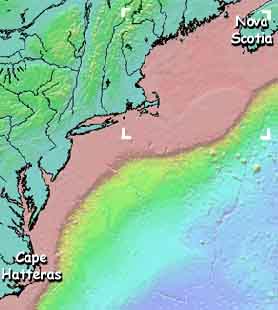
- The continental shelf
- A gently sloping surface that extends from the coastline to a marked increase in offshore slope
- The continental slope
- A relatively steeply sloping surface found seaward of the shelf
- The continental rise
- A gently sloping surface at the base of the slope
Let's focus on one area on the continental margin, the Gulf of Maine (its "corners" are shown as white, above ^^^ ). A detailed view of Gulf of Maine bathymetry is shown in black-and-white below (VVV).
This a contour map. Its lines join points of equal depth.
- Because black-and-white contour maps can be somewhat confusing to interpret,
many oceanographers prefer to use color-coded maps to look at bathymetry
data.
- Click here to see another example of color-coded bathymetry from the Gulf of Maine.
- See a Gulf of Maine bathmetry "fly-by" animation.
 |
- Visit the "Measured
and Estimated Seafloor Topography" website.
- Look at the bathymetry data from the following
areas:
- Western Pacific Ocean (near the Philippines and Japan)
- Western Indian Ocean (off the east coast of Africa and south of India)
- North Atlantic Ocean (off the U.S. east coast)
- Is the bathymetry of the North Atlantic more similar to that of the Western Pacific Ocean or Western Indian Ocean?
- Would the floor of the North Atlantic's be better
described as mostly an "innie" or an "outie"?
- BONUS QUESTION: The bathymetric maps
at this website were created by "combining ship depth soundings
with high-resolution marine gravity data from Earth-orbiting satellites."
- How can marine GRAVITY data help to determine the depth of the sea floor??!!
- BONUS QUESTION: The bathymetric maps
at this website were created by "combining ship depth soundings
with high-resolution marine gravity data from Earth-orbiting satellites."
- Look at the bathymetry data from the following
areas:
- Review the descriptions of the three
zones within a typical continental margin.
- Again look at the color-coded
image of the bathymetry between Nova Scotia and Cape Hatteras.
- Can you identfy:
- the continental shelf?
- the continental slope?
- the continental rise?
- [You may wish to print the image and trace these features onto it.]
- Can you identfy:
- Again look at the color-coded
image of the bathymetry between Nova Scotia and Cape Hatteras.
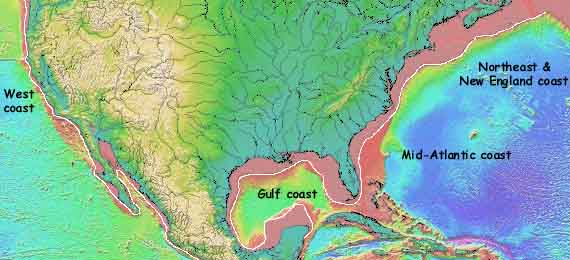
- Look at the map below (VVV)
that shows bathymetry off much of North America.
- What varies more:
- the DEPTH of the continental shelf or the WIDTH of the continental shelf?
- Is the continental shelf off of New England's
coast relatively narrow or wide?
- Can you guess how having this type of continental shelf might affect currents and fish population?
- Is the continental shelf closest to where you
live relatively narrow or wide?
- Can you guess how the width of "your" continental shelf might affect currents and fish population?
- What varies more:
4. Print a black-and-white contour map of Gulf of Maine bathymetry:
- Click here to get the small version of the map.
- Click here to get the large
version of the map.
- Using colors like those shown on this depth
scale, trace over the CONTOUR LINES ONLY.
- [NOTE: The maps do show depth below sea level although the contour lines are not marked as negative numbers.]
- [HINT: Not all colors will be used!]
- Using colors like those shown on this depth
scale, trace over the CONTOUR LINES ONLY.
- Compare the black-and-white contour map with your color-coded map.
- Which map makes it easier to distinguish relative depths in the Gulf of Maine?
- How would you describe Georges Bank: relatively
shallow or relatively deep?
- The color-coded scale for the global "Seafloor Topography" map was created to show bathymetry from sea level to greater than 7000 meters depth.
- The depth scale provided for the Gulf of Maine
(just above, ^^^) is altered from that map.
- Can you name three or more changes between the two scales?
- Why was it a good idea to use a different color scale for the Gulf of Maine bathymetry map?
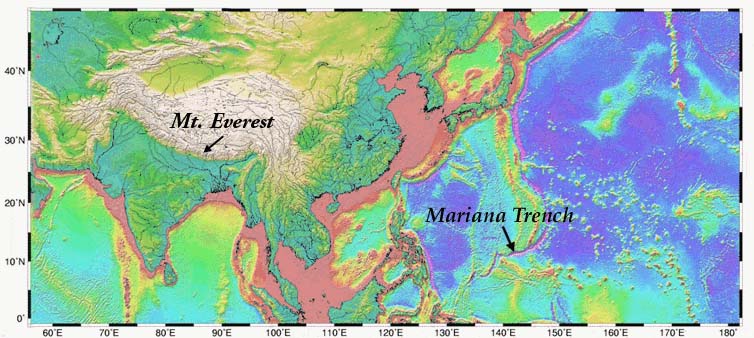
5. Now that you've gotten familiar with global bathymetry data, which do you think is shows more variation -- or change -- from sea level:
- Mt. Everest (highest land elevation) or the Mariana Trench (deepest ocean trench)?
- Why did you choose this feature?
- Click here
to see a color-coded map with arrows that point to Mt. Everest and
the Mariana Trench.
- Does this help you to answer the question?
- Why or why not? [If you need more help discovering which of these features has more variation from sea level, you may want to check an atlas or world almanac.]
- Click here
to see a color-coded map with arrows that point to Mt. Everest and
the Mariana Trench.
 |
|
|
 |
 |
|
