 |
 |
|||||||||||||||
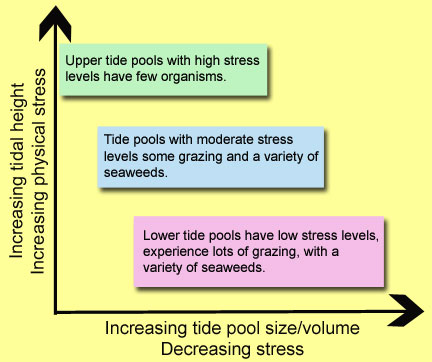
Let's take a closer look at how zonation affects the ecology and biology of tide pools along the shore. The graph above describes the stress levels in tide pools at various levels plotted against the dimensions of the pool. By rolling over each box you can view a detailed description of the ecology for low, middle, and upper tide pool locations. |
||||||||||||||||
|
||||||||||||||||
|
||||||||||||||||