


Patterns of seasonal change are interesting on the local
scale – leaf color changes in the fall, visits to the beach or pool
during the summer – and also from the "bird's eye" view
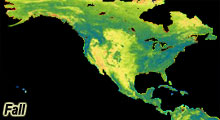
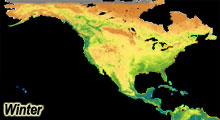
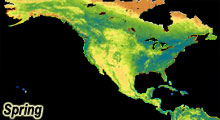
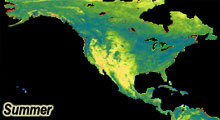
of a satellite. These images show seasonal changes in North America measured
as a "Vegetation Index": the browns indicate low vegetation
and the greens a lot of plant coverage. Note the dramatic changes in land
vegetation from season to season.
 |
 |
 |
 |
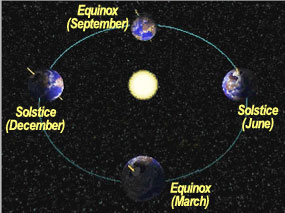 |
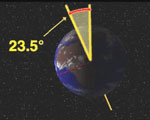
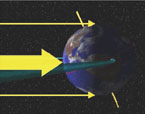
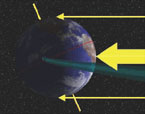
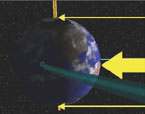
Seasons are tied to the degree of direct solar radiation that hits an area and the amount of time that area is exposed to the sun's rays. A simple demonstration of this concept is done using a flashlight. Take a flashlight and point the beam of light on an object on the ground. Concentrate the light at that spot. Now take the flashlight and tilt it at an angle. The light becomes dispersed across the ground, rather than concentrated on the object. The Earth goes through a similar process during a year. << Sun and Earth are not shown to scale |
 |
 |
 |
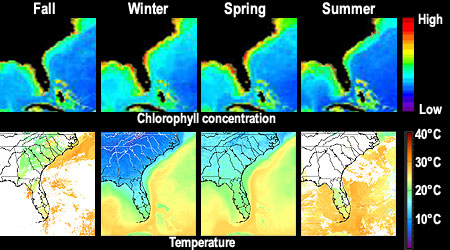
- Observe seasonal change in ocean chlorophyll content
- Understand ties between between sunlight, nutrients, plant growth and ocean conditions such as sea surface temperature and winds
Maps of seasonal ocean color and temperature for
one of these regions:
Maps of average ocean wind data near North America
for these seasons:
|
To introduce this activity, review seasonal change
on landmasses by accessing the images above.
Discuss what factors influence vegetation patterns on land (e.g.,
temperature, sunlight, nutrients, rainfall, etc.). Also discuss
which of these factors may influence ocean primary productivity,
seen in ocean color images as chlorophyll concentration.
|
|
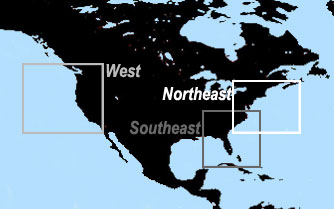
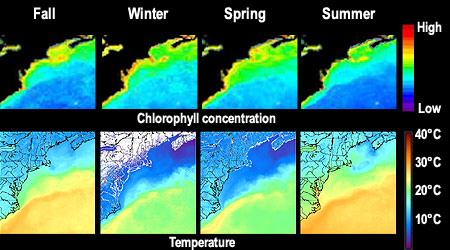
- Divide the class into three groups and assign each (or allow them to choose) an ocean region to examine: | Western U.S. || Southeastern U.S. || Northeastern U.S. | (or click on boxes above). Make sure that all three regions are explored by the class.
- For each area, they will see seasonal patterns of ocean color (top) and sea surface temperature (bottom). They should familiarize themselves with the color-coded scale for each measurement (at far right). In general, red = high chlorophyll / temperature and purple = low chlorophyll / temperature. Note that in the temperature images, white = no data; this usually occurs in cloud-covered areas.
- Examine the ocean color data (top). In general, where do you find the highest values for ocean chlorophyll concentration? Do patterns of ocean chlorophyll concentration change from season-to-season. In what ways?
- Examine the temperature data (bottom). In this region, does sea surface temperature change from season-to-season. In what ways? Which season -- if any -- generally has the highest sea surface temperature? Which season has generally the lowest sea surface temperatures?
- In your region, is there a correlation between sea surface temperature and chlorophyll concentration? Can you guess why or why not?
- Primary productivity in the oceans -- and the concentration of chlorophyll -- are tied to phytoplankton growth. In general, phytoplankton grow & reproduce when they get enough nutrients, carbon and light. Because carbon is readily available in the ocean as carbon dioxide, the usual "limiting" factors for phytoplankton growth are light and nutrients.
- The seasonal variability in sunlight is addressed in
the material above. But why might nutrient availability vary with
time? Nutrients accumulate in deeper waters because of gravity. When
transported to the surface, these cold, nutrient-rich waters stimulate
phytoplankton growth. Here are some processes by which deeper waters
rise to the sea surface.
- Heating by the sun can cause a physical "density barrier" to form in the oceans, separating the sea surface from colder, nutrient-rich waters below. This barrier is called the thermocline -- a thin layer where temperature changes abruptly. However, another factor is the mixing of ocean waters, mostly by winds: sustained strong winds tend to break down the thermocline and help mix nutrients to the surface. The images below illustrate how phytoplankton -- that need both sunlight AND nutrients -- might fare from season-to-season;
- In areas with north-south oriented coastlines, upwelling of deep waters can occur when winds blow along the coast and towards the Equator. In these situations, Earth's rotation causes surface waters to move 90 degrees to the right of wind direction, away from shore (for example, 90 degrees right of south-blowing wind = westward transport of surface water). Then deep, cold, nutrient-rich waters upwell to replace it. (Click here for a movie about upwelling; 1.5 MB.)
- With these concepts in mind, have students examine wind data for their regions. They should look at wind strength and direction, and summarize the data by season (i.e., look at general trends for the three months in each season): | Winter wind data | Spring wind data | Summer wind data | Fall wind data |
- Given their knowledge of upwelling, vertical mixing and seasonal heating -- and their examination of sea surface temperature and wind data -- how do they explain the seasonal patterns of ocean color for their region of interest?
- How do the three regions compare with one another?
 |
 |
 |
 |
- Based on what you've learned, can you explain the seasonal change in chlorophyll content along the equator as shown in this movie showing seasonal ocean color change near North America?


