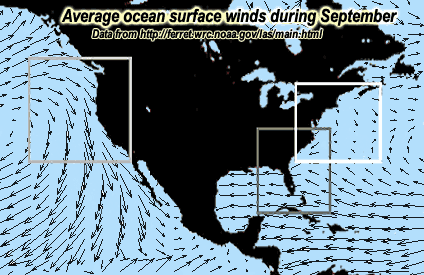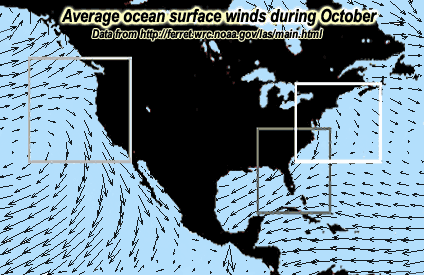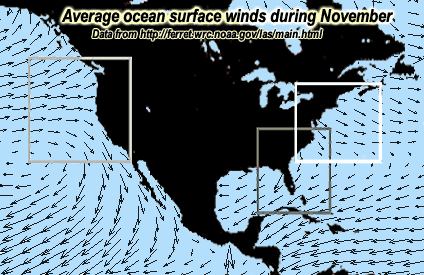
These maps show ocean surface wind data for typical
months in FALL, averaged over many years. Scientists refer to these
as climatology data. Ocean surface wind direction and strength
are shown as arrows. Short arrows indicate lighter winds and longer arrows
show stronger winds. The arrows also show the average direction that winds
were blowing during that month. These maps are based on data from NOAA's
"Live Access to Climate Data" website.