Water Levels Along U.S. Coasts &
"Tide Types"
 |
|
The National Oceanic & Atmospheric Administration's (NOAA) Oceanographic Products and Services Division collects, analyzes and distributes observations and predictions of water levels, coastal currents, and other data.
You can plot "Water Level" data by finding their "Station Locator" page.
- From this page, choose any state that has a coastline (most are color
coded as bright yellow).
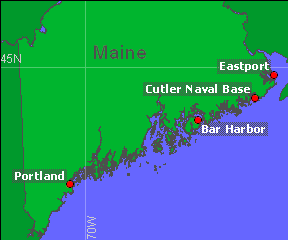
- For example, you could choose the state of Maine.
- This gives a map of where ocean data are collected along Maine's coast.
- For example, we will focus on:
- Eastport, Maine
- For example, you could choose the state of Maine.
To get today's "Water Level" data for Eastport:
- Use the "pull-down" menu to "Select station from list" (<<<)
- You'll reach a"Data Plots" page
- For example:
- You will see today's "Water Level"
- The red dotted line is predicted water level
- The blue solid line is the measured water level
For your area of interest, you may also see plots of the following types of data:
- Wind speed (red dots) and direction (blue arrows)
- Air Pressure
- Air temperature (blue line) and water temperature (red line)
 |
- Many factors influence ocean tides. However, all coasts fall into one of three simple "tide types".
- (Scroll down or click here
to see the water levels associated with these "tide types"):
- DIURNAL
- One high and one low tide per day;
- SEMIDIURNAL
- Two similar high tides and two similar low tides per day; and
- MIXED
- Two high and two low tides per day BUT with successive high tide levels that are VERY DIFFERENT from each other
- DIURNAL
- Look at "Water Level Plots" for your
area(s) of interest.
- What type of tides (diurnal, semidiurnal, or mixed) did you find?
- Check out the example plot
for Eastport, Maine.
- Are these diurnal, semidiurnal or mixed tides?
- Starting from the "Station
Locator" page for the whole U.S., access "Water Level
Plots" from 2 or 3 points in each of these regions:
- Mid-Atlantic coast
- Southeast coast
- Gulf Coast
- West Coast
- Were you able to find ALL THREE tide types (diurnal, semidiurnal, mixed)?
- Did you find a correlation between geographic region and coastal tide type?
- At a given place, the difference in the height between
consecutive high and low water levels is known as the tidal range.
- Are the tidal ranges the same for all the stations you examined?
- Can you guess why or why not?
- Tidal ranges depend on the configuration of the coastline and local water depth (in addition to other, less significant factors).
- To better understand EXTREME tidal ranges, look at the example plot for Eastport, Maine.
- How does the tidal range of Eastport from other areas you examined?
- Does the location map for the Eastport station help to explain the observed tidal range?
- Is your understanding helped by knowing that
the WORLD'S HIGHEST tidal range (up to 15 meters -- about 50
feet) occurs in the Bay of Fundy, the long narrow bay between Nova Scotia
and New Brunswick?
- Learn about how high tidal ranges can be used to generate electrical power by doing an activity called "Harvesting Energy From Tides."
- A datum (from the Latin term meaning "something
given") is a point, line, or surface that is used as a reference.
- On your plots of water levels, the datum shown
is the "Mean Lower Low Water (MLLW)." This is defined
as the mean (or average) of the "lower of two low waters occuring
during a tidal day."
- To better understand this definition, see graphs of water level for semidiurnal and mixed "tide types" (below, VVV).
- On your plots of water levels, do ALL lower
low tides exactly reach the MLLW level?
- Why or why not?
- Look at the plots of tide types (below, VVV).
The bright green line is the datum for these plots.
- Do these plots use the "mean lower low water" level as the datum?
- Can you guess what the datum on each of these plots represents?
- On your plots of water levels, the datum shown
is the "Mean Lower Low Water (MLLW)." This is defined
as the mean (or average) of the "lower of two low waters occuring
during a tidal day."
The water levels associated with three common tide types are shown:
1) Diurnal
2) Semi-diurnal
3) Mixed
 |
|
 |
 |
 |