| |
PROCEDURE
|
|
Preparation
- Briefly discuss how Earth's geography is given in a coordinate
system made up of latitude and longitude.
- Compare a world map and an Earth globe. Note the differences
in how lines of latitude and longitude are represented.
|
|
| |
|
Activity - Step 1 "About Mercator
Projection"
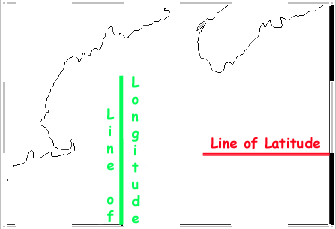
1. On a "Mercator projection,"
lines of latitude are parallel to each other and lines of
longitude are also parallel to each other. So latitude and
longitude are perpendicular.
|
 |
Questions - Step 1
- Look at an Earth globe. Are lines of latitude
parallel to each other? Are lines of longitude parallel to each
other? [HINT: At Earth's poles, which
lines intesect... latitude or longitude? Do parallel lines ever
intersect?]
|
|
| |
|
Activity - Step 2 "The 'Greenland
Problem'"
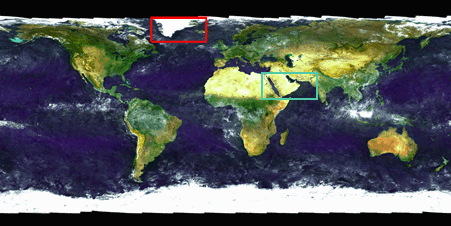
- Most people are accustomed to using
Mercator projection maps. Although this projection is fine
for many purposes, it's not the best way to represent
an area that covers many degrees of latitude. For example,
southern Greenland (near the north pole) is actually
smaller than the Arabian peninsula (near the equator).
|
|
|
Questions - Step 2
- Why does southern Greenland (red box,
above) look bigger than the Arabian peninsula (middle of green
box, above) in Mercator projection maps?
|
|
| |
|
Activity - Step 3
"True View of Earth"
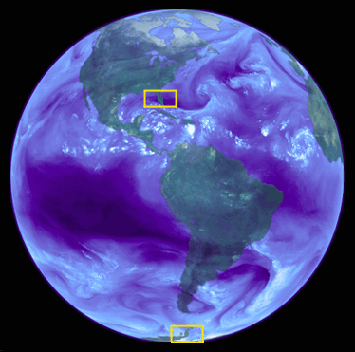
1.At right (>>>), the earth is viewed as a hemisphere
("hemi" is "half" in Latin and Greek).
Because our spherical planet has not been "flattened"
onto a map, the relative sizes of landmasses is not distorted.
2. Yellow boxes outline the two areas we are going to compare
in this Mercator Projection:
- southeastern U.S.
- Antarctic peninsula.
3. Click here to learn more about this
image.
|
 |
|
|
| |
|
Activity - Step 4
"Create a 20° by 20° Map of the Southeastern
U.S."
At the "Coastline
Extactor" website, you will choose a 20 degree latitude
by 20 degree longitude area as follows:
1. Under the "Geographic Range of Extracted Coastline,"
type in the northermost latitude as "40".
2. Type in the westernmost longitude as "-95" (NOTE:
For this map-making tool, negative longitude is west
of Greenwich).
3. Type in the easternmost longitude as "-75".
4. Type in the southernmost latitude as "20".
5. Using the "pull down menu" under "Coastline
data base," choose the option: "WCL
(World Coast Line) (designed for 1:5,000,000)".
Or you can choose another data base if you want a more
detailed map.
6. Leave the rest of the "clickable" buttons alone.
|
|
|
7. Hit "SUBMIT" to "extract the coast."
(After you've hit "SUBMIT," you may get a "warning
message" that says "Any information that you submit
is insecure..." Hit "OK" to continue.)
8. Your map will appear as an image on top. Latitude and
longitude data, formatted as two columns, are called "XXXX.dat."
( XXXX is a number generated by the program itself.)
9. Print the map.
|
|
|
| |
|
Activity - Step 5"Create
a 20° by 20° Map of the Anarctic Peninsula"
At the "Coastline
Extactor" website, you will choose another 20 degree
latitude by 20 degree longitude area as follows:
1. Your two latitudes of interest are "-55" and
"-75".
2. Your two longitudes of interest are also "-55"
and "-75" (REMEMBER: For this map-making tool, negative
longitude is west of Greenwich).
3. Think carefully and then fill your data on the website
(shown as "???" at right >>>).
4. You'll get an "error message" if you've entered
data incorrectly.
5. Using the "pull down menu" under "Coastline
data base," choose the option: "WCL
(World Coast Line) (designed for 1:5,000,000)".
Or you can choose another data base if you want
a more detailed map.
6. Leave the rest of the "clickable" buttons alone.
|
|
|
7. Hit "SUBMIT" to "extract the coast."
(After you've hit "SUBMIT," you may get a "warning
message" that says "Any information that you submit
is insecure..." Hit "OK" to continue.)
8. Your map will appear as an image on top. Latitude and
longitude data, formatted as two columns, are called "XXXX.dat."
( XXXX is a number generated by the program itself.)
9. Print the map.
|
Questions - Step 5
- Compare the two maps you've generated.
- Which is longer? Why?
- Which is wider? Why?
- Think about the range of longitude each
map covers.
- How would the two maps "line
up"? (In other words, do these areas lie directly above
/ below one another, left / right of one another, or both?)
- Given that the Antarctic Peninsula
lies just south of South America, does the result surprise
you?
|
|
| |
|
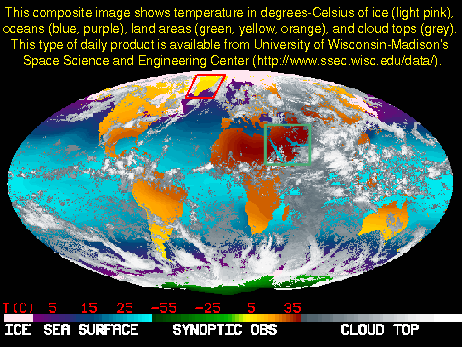
Activity - Step 6
- This activity has shown that Meractor
Projection maps are not well-suited for maps whose area
covers many degrees of latitude. For this reason, scientists
who study the global earth prefer to use map projections
such as the "Mollweide projection" (shown below,
VVV).
[Map is from University
of Wisconsin-Madison's Space Science & Engineering Center
.]
|
 |
|
Questions - Step 6
- How does a "Mollweide Projection"
differ from a Mercator Projection?
- How does a "Mollweide Projection"
differ from a hemispheric projection?
- Click here
to see an example of a hemispheric projection.
- Why is a hemispheric projection not suitable for scientists
who study the "whole earth" simultaneously?
- Are lines of latitude parallel on
a Mollweide Projection? What about longitude lines?
- How does the Mollweide Projection
"handle" the relative sizes of southern Greenland
(red "square") and the Arabian peninsula (green
square)?
|
|
|
EXTENSION
- Use a world map to locate another coastline area to "extract"
using the "Coastline
Extractor" website. They may wish to choose an area that is
west of the International Date Line.
- Complete the "Extracting A
Coastline" activity.
- Research some other types of map projections. For each type discovered,
determine the following:
- What makes that map projection unique?
- Who uses that type of map projection?
- Complete the "Map
Projections" activity (hosted at the Gulf of Maine Aquarium
website).
|
|
| |
VOCABULARY
- latitude: location on Earth's surface
based on angular distance north or south of the equator. Equator, 0°;
North Pole, 90°N; South Pole, 90°S.
- longitude: distance (expressed in degrees)
east or west of the prime meridian, along which Greenwich, England is
located. The International Date Line is 180° away from the prime
meridian.
- perpendicular: a line or plane at right
angles to another line or plane.
|
|