 |
|
Our Route...Continued |
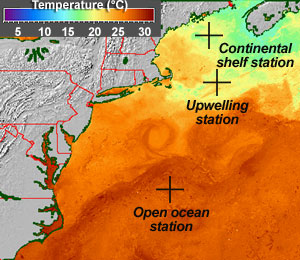
| Now let’s take a closer look at our cruise path... The three stations that are of special interest to us are the Continental Shelf Station, the Upwelling Zone Station, and the Open Ocean Station. Each of these stations are in very different parts of the ocean. Let's learn a little more about each of these areas before we start our experiments. |
 |
 |
|
The map to the right gives you an indication of sea surface temperature and ocean color. The ocean color is actually primary productivity measured as amount of chlorophyll. Use your cursor to toggle between the temperature and ocean color maps. On the cruise track below, click on each of our three stations (Continental Shelf, Upwelling Zone and Open Ocean) to learn more about each one. |
||
|
|
At each station, we collected water at various depths. To do this, we lowered a frame with bottles attached to it over the side of the ship. (Click here to see photos of the frame). We then electronically closed the bottles at different depths to capture water and bring it to the surface for analysis. The blue circles on the map are places where we took water samples. |
| <<<Look Back |