| |
INVESTIGATIONS
|
|
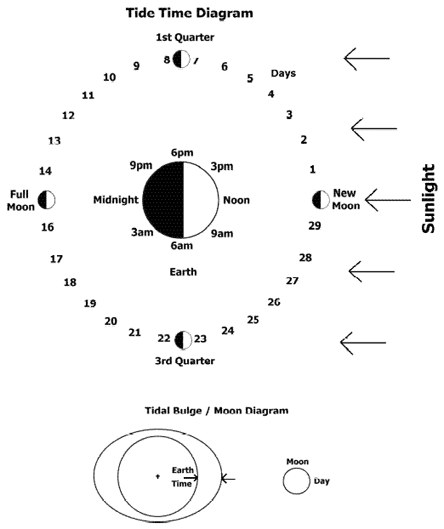
- Examine the Tide Time Diagram. The diagram
(not drawn to scale) shows Earth at the center as seen from far
above Earth's North Pole. The counterclockwise rotation of Earth
and the direc-tion of light arriving from the distant sun are
shown. Earth time is marked in one hour intervals along the circumference
of the planet. Since Earth rotates 360 degrees in 24 hours, each
hour a fixed point on Earth rotates (5) (10) (15) degrees.
- The large circular ring in the diagram shows the daily positions
of the Moon relative to Earth during one lunar month lasting from
one new Moon phase to the next new Moon. (The 29.5-day lunar month
has been rounded to 30 days for the purposes of this activity.)
Every day, the moon's position advances about (10) (12) (15) degrees
along the circle representing the 30-day month.
- The lower Tital Bulge/Moon Diagam, viewed from the same perspective
as the upper drawing, is of the Moon and Earth with the depth
of the ocean greatly exaggerated. It shows the theoretical locations
of the ocean's two dominant tidal bulges. One always faces the
Moon (where lunar gravitation is strongest) and the other always
faces directly away (where lunar gravitation is weakest). Make
a tracing or photocopy of the lower diagram on a clear plastic
sheet. Place this directly over the upper diagram so that the
center points of the diagrams coincide. Use a sharp pencil to
hold the two together at their centers. Twist the overlay so the
Moon progresses from one daily position to the next. The moon
is advancing in the (same) (opposite) direction as Earth's rotation.
- Place the Moon at its Day 1 position. A point on Earth rotating
through the center of the bulge facing the Moon would experience
a high tide at this time. The time, found by reading the time
on Earth clock indicated by the "Solar Time" arrow pointing
at the high tide bulge, would be about (12:50) (1:30) (2:50) p.m.
- Advance the Moon to its day 2 position. On this day, a point
on Earth rotating through the same bulge would experience a high
tide at about (12:50) (1:40) (2:30) p.m.
- Comparing the time of the Day 2 high tide to the Day 1 high
tide, the time of the high tide is about (1) (2) (3) hour(s) later
than the day before.
- Just as it takes more than one hour for the minute hand of a
clock to make two successive passes of the advancing hour hand,
it takes (less than 24) (24) (more than 24) hours for a point
on Earth to pass through and catch up with the same advancing
tidal bulge. That is why comparable local high and low tides occur
later from one day to the next.
- The time lag investigated in this activity is typically less
than an hour, but how much less? To make an estimate, determine
from the diagrams the times of comparable high tide on Day 10
and Day 20. From this information, find how many minutes later
the tide occurred on Day 20 than on Day 10, and divide by 10.
According to these calculations, the daily time lag rounds off
to about (40) (50) (55) minutes.
|
|
|
|
