|
|
"Building a Bloom" Note to teachers: Click here to see the printable version of this content. |
|
What is an algal bloom? An algal bloom is a rapid increase in the number of algal cells such that the algae dominate the planktonic community. |
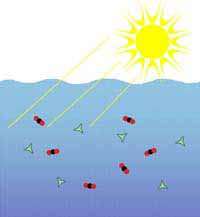
| What causes an algal bloom? That question isn’t as easy to answer. Like land plants, algae need certain things to grow – water, carbon dioxide, sunlight and nutrients. Carbon dioxide is plentiful in the marine environment, but sunlight and nutrients can be scarce. Sunlight is available near the surface of the water, so algae grow readily when they can remain near the surface. Nutrients are abundant in areas of run-off where water flows over land and picks up minerals that are then carried to the sea. Nutrients are also plentiful in areas where cool, deep, nutrient-rich waters are brought to the surface due to upwelling, tides or wind-driven mixing. When the algal cells get everything they need to grow, they can divide very rapidly and potentially create a bloom. |
|
|
Of course, it is a little more complicated than just getting sunlight and nutrients. Phytoplankton live in a very dynamic environment. The ocean is always moving and algae and nutrients move with it. Not only can regional circulation patterns affect the nutrient concentrations in the water, but they can also actually physically concentrate or disperse algal cells. In addition, many algal species thrive under only certain temperature and salinity conditions. And finally, for algae to bloom successfully, there must be a limited number of grazers in the area. After all, if there were enough grazers to keep the algal population under control, there wouldn’t be a bloom. Click here to see some common HAB species and to learn about their optimal growth conditions. |
Baden, D.G. 1998. Center for Marine Science Research, University of North Carolina Wilmington, Wilmington, NC. In: Bushaw-Newton, K.L. and Sellner, K.G. 1999 (on-line). Harmful Algal Blooms - NOAA's State of the Coast Report. Silver Spring, MD: National Oceanic and Atmospheric Administration. |
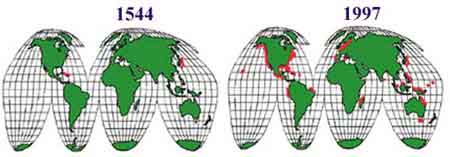
After
reading about all that can affect the occurrence of an algal bloom, you
might think that it would be rare for all of the conditions to be right
and for a bloom to occur. However, as you can see by the red markers on
the maps to the left, observations of reported harmful algal blooms are
increasing in frequency. Click here
to see what types of HABs occur in different areas of the U.S. |
| Why
are the reports of HABs increasing? Scientists have offered numerous
explanations. One possible explanation is that we are introducing exotic
species through ballast water and aquaculture. The exotic species may
be able to thrive in the new area, but may not have a grazer in that area
to keep its population under control. A second possible explanation is
that certain algae are inhibiting grazers, so the grazers are physically
unable to control the algal population. Another possible explanation that
has been proposed is that our global climate changes are creating conditions
that favor the blooms. It has also been suggested that human activity
has played an integral role in an increase of harmful algal blooms by
increasing the amount of pollution and nutrients released into the environment,
by degrading habitat, and by modifying water flow. Lastly, it has been
proposed that the frequency of blooms is not increasing, but that we have
developed better detection and monitoring methods so we are noticing more
of the blooms that have always been occurring. Of course, as you have probably already realized, it is possible that every single one of the proposed explanations is correct at some level. One thing that scientists are doing now is studying what factors are contributing to the causes of different blooms. |
|
|
To receive the greatest benefit from the activity, students should have a basic knowledge of algae and their role in the food web. This can be accomplished by having the students read the above content and participate in "Fitting Algae Into the Food Web." Other valuable resources include NOAA's State of the Coast Report on Harmful Algal Blooms and Bigelow's "Toxic and Harmful Algal Blooms." |
|
Making
Algae Bloom |
| Note
to teachers: Please dispose of your algal cultures responsibly. Do
not allow your students to pour their algal cultures down the drain without
treating the cultures first. There are a couple of ways to dispose
of algal cultures. (1) Microwave the cultures (in a microwave-safe container)
until they boil. This can be done in a regular microwave used for food
preparation. Although it may not smell pleasant, it will not contaminate
your microwave. After the microwaved cultures have cooled, they can be
poured down the drain. (2) Add bleach to the cultures to make a 1% solution.
After allowing the bleached cultures to sit overnight, pour them down
the drain with plenty of running water. |
Students will devise their
own experiments to test the effects of nutrients on algal growth. Remind
students that they need to have controls and replicates in their experiments.
Make sure the students formulate hypotheses before their experiments
commence. A simple example experiment is described below. (Note
to teachers: Click here to see the
printable version of this example experiment). Example Experiment:
|
|
Note to teachers: Click here to see the printable version of this extension. |
| Since the 1970’s, many states have enacted detergent phosphate bans or restrictions in the attempt to minimize eutrophication of lakes. (For more information see the EPA's web site or download the EPA's publication, The Quality of Our Nation's Water, or visit the U.S. Geological Survey's Water Science for Schools web site. Investigate the detergent phosphate regulations in your state and report your findings to your class. Things you might want to discuss include:
|
|
|
Phytoplankton can be found in every water body around. Using plastic containers, collect water from a local lake or bay. Filter the water through filter paper to concentrate the cells, and wash what was caught on the filter paper into a shallow glass container or petri dish. Use some of the filtered water for your wash. Look at the cells you collected with a dissecting microscope. Record your observations. Include sketches with your written descriptions. Do you think you captured more than one species of plankton? Can you tell the difference between the phytoplankton and the zooplankton? Are all of the cells solitary, or are some in colonies? Do any cells have spines or hair-like appendages? Use books, the internet, or Phytopia to help identify the types of plankton you found. |
|
| Phytopia is an educational CD-ROM that consists of a searchable database of many important planktonic protists, including many that are harmful, in addition to a Bloom Activation Tool. This interactive tool uses satellite-based images to help students understand how changes in environmental factors – sunlight, ocean temperature, wind and ocean currents – affect phytoplankton productivity and ocean health. This CD-ROM, developed by Bigelow Laboratory for Ocean Sciences, the University of New England, and NASA’s Jet Propulsion Laboratory, is available to educators through Bigelow's web site. |
|
This table summarizes the McREL science standards that are met through this lesson. To see a detailed list of standards that this lesson addresses, please click here.
|
|
|