 |
|
Our Data...Water Column Profiles |
|
|
Cruise Activity #4: Interpret the data from our water column profiles. A printable Water Column Profile Data Sheet is provided to guide you. If you do not have Adobe Acrobat or another way to view PDF files, click here to download the free software. |
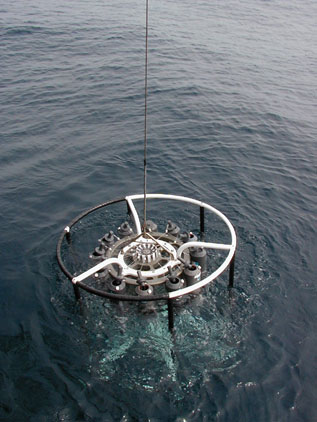
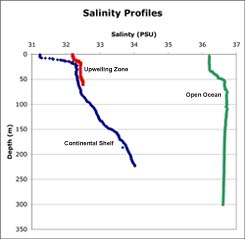
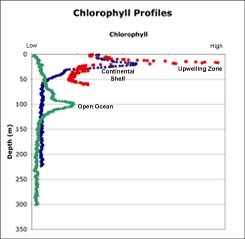
| At each station we collected data on the temperature, salinity, density and chlorophyll throughout the water column. We collected these data by sending a rosette over the side of the ship and lowering it to a designated depth. As it was lowered, a fluorometer measured in-water chlorophyll concentrations and a CTD provided temperature, salinity and depth data. The CTD data help provide us with a picture of the vertical structure of the water column. Remember that the density of water is affected by temperature, salinity and pressure. Generally, cold, salty water is denser and will sink beneath warm, fresh water. The vertical structure of the water column can affect the movement of nutrients and organisms between the surface and deeper waters. The chlorophyll data provide us with an indication of the phytoplankton concentration throughout the water column. The temperature, salinity and chlorophyll profiles from our stations are shown below. Click on each one to see a larger version.
|
 |
|
|
 |
 |